Efficiency Unveiled: The Role of Pareto Charts in Project Management Collaboration
Introduction
Navigating the complex landscape of collaborative project management necessitates a keen focus on efficiency, acting as the linchpin that distinguishes success from chaos. This comprehensive exploration of Pareto charts and their transformative impact on collaborative projects unfolds as a journey promising profound insights into optimizing project efficiency.
Understanding Project Efficiency
Efficiency in teamwork is paramount for successful projects. It involves smart resource utilization, meeting deadlines, and achieving goals seamlessly. Picture it as assembling a puzzle – each piece fitting perfectly to reveal the whole picture. This forms the foundation before we delve into how Pareto charts can enhance efficiency further.
Introduction to Pareto Charts
Embarking on the exploration of Pareto charts unveils their fundamental principles, grounded in the 80/20 rule, asserting that 80% of effects come from 20% of causes. Pareto charts visually represent this as dynamic lenses highlighting critical elements in collaborative projects' complexity. It's a unique tool that magnifies what truly matters in a sea of information, offering unique perspectives.
Pareto charts are a visual representation of data, and their power lies in the insights they provide based on the Pareto Principle, also known as the 80/20 rule. According to this theory, about 20% of the causes account for 80% of the effects in many circumstances. In the context of collaborative project management, a significant portion of the project's impact is derived from a small set of factors or activities.
Pareto Charts in Action
This segment delves into the practical side of Pareto charts, demonstrating how they identify crucial factors influencing collaborative projects. Picture Pareto charts as expert detectives pinpointing aspects that make or break a project's success. They uncover bottlenecks, visually prioritizing improvements and optimizing resource allocation like wizards. This section showcases their adaptability and effectiveness through practical examples and case studies, making them actionable tools in real-world collaborative dynamics.
Imagine that a project manager is confronted with a project timeline that needs to catch up because of a number of problems. By applying Pareto analysis, the manager can identify the critical issues causing the most significant delays. It could be that a specific task or a particular team is consistently causing delays. The Pareto chart will visually highlight this, allowing the manager to focus efforts on resolving the most impactful issues first.
Furthermore, Pareto charts can be instrumental in resource optimization. In a collaborative project where resources are often scarce and need to be allocated judiciously, Pareto charts can reveal which tasks or activities contribute the most to the project's success. This facilitates the allocation of resources by project managers to areas where they will yield the most significant impact.
Implementation of Pareto Charts in Project Collaboration
This section provides clear steps for project managers to implement Pareto charts. It's like a recipe for success, starting with selecting relevant data as ingredients and guiding through designing and interpreting Pareto charts. Think of it as a user manual for this powerful tool, connecting conceptual understanding to practical application seamlessly.
The implementation of Pareto charts involves several key steps. Firstly, project managers need to identify the relevant data for the analysis. This could include various project metrics, such as task completion times, resource utilization, and project milestones. Once the data is collected, the next step is to organize it in a way that makes sense for Pareto analysis.
Benefits of Pareto Charts in Project Collaboration
Explore the various advantages Pareto charts bring to collaborative project management. They streamline task prioritization, ensuring teams focus on impactful factors. Pareto charts act as communication enhancers, conveying complex data concisely. In decision-making, they serve as guiding lights, enabling informed choices by addressing critical issues. The emphasis is on tangible benefits, showcasing how Pareto charts contribute to overall efficiency.
One significant benefit of Pareto charts in collaborative project management is their ability to streamline task prioritization. When a team is faced with multiple tasks and deadlines, it can be challenging to determine where to allocate resources first. Pareto charts provide a visual representation of the tasks that have the most significant impact on the project's success. This allows teams to prioritize their efforts on the tasks that truly matter, ensuring crucial activities take precedence.
Moreover, Pareto charts act as communication enhancers in collaborative projects. Complex data and information can often be overwhelming for team members. Pareto charts simplify this complexity by visually highlighting the most critical factors. This not only makes it easier for team members to understand the key drivers of success but also facilitates more effective communication among team members and stakeholders.
In decision-making, Pareto charts serve as guiding lights for project managers. Project managers can make informed choices by identifying and addressing the most critical issues affecting project success. This is particularly crucial in collaborative projects where decisions impact multiple team members and departments. Pareto charts provide a clear and structured way to prioritize decisions, ensuring that the most impactful issues are addressed first.
Overcoming Challenges in Utilizing Pareto Charts
Address challenges in using Pareto charts preparing project managers for potential roadblocks. Being adaptable tools, Pareto charts can overcome complexities in collaborative projects, providing insights for successful navigation. It's like having a roadmap for project managers to steer through challenges and ensure smooth implementation.
While Pareto charts offer valuable insights, there can be challenges in their effective utilization. One common challenge is the availability and quality of data. Data is crucial for Pareto analysis to be meaningful, accurate, and relevant. Gathering comprehensive and accurate data can be challenging in collaborative projects where data may be dispersed across different teams and systems.
To overcome this challenge, project managers need to establish transparent data collection processes from the project's outset. This may involve implementing standardized reporting mechanisms ensuring that all relevant data points are consistently captured. Additionally, leveraging project management tools that facilitate real-time data tracking can significantly enhance the accuracy and availability of data for Pareto analysis.
Another challenge in utilizing Pareto charts effectively is ensuring that the identified priorities align with overall project goals. In collaborative projects involving multiple teams with diverse objectives, it's essential to ensure that the Pareto analysis aligns with the overarching project objectives. This requires effective communication and collaboration among team members to validate and refine the identified priorities.
Integrating Pareto Charts into Collaborative Platforms
Explore the integration of Pareto charts into collaborative platforms within the technological landscape. This section focuses on showcasing tools and technologies supporting seamless integration. It's a journey into the digital evolution of collaborative platforms, illustrating how Pareto charts fit into the digital toolkit of project managers, enhancing efficiency and data-driven workflow.
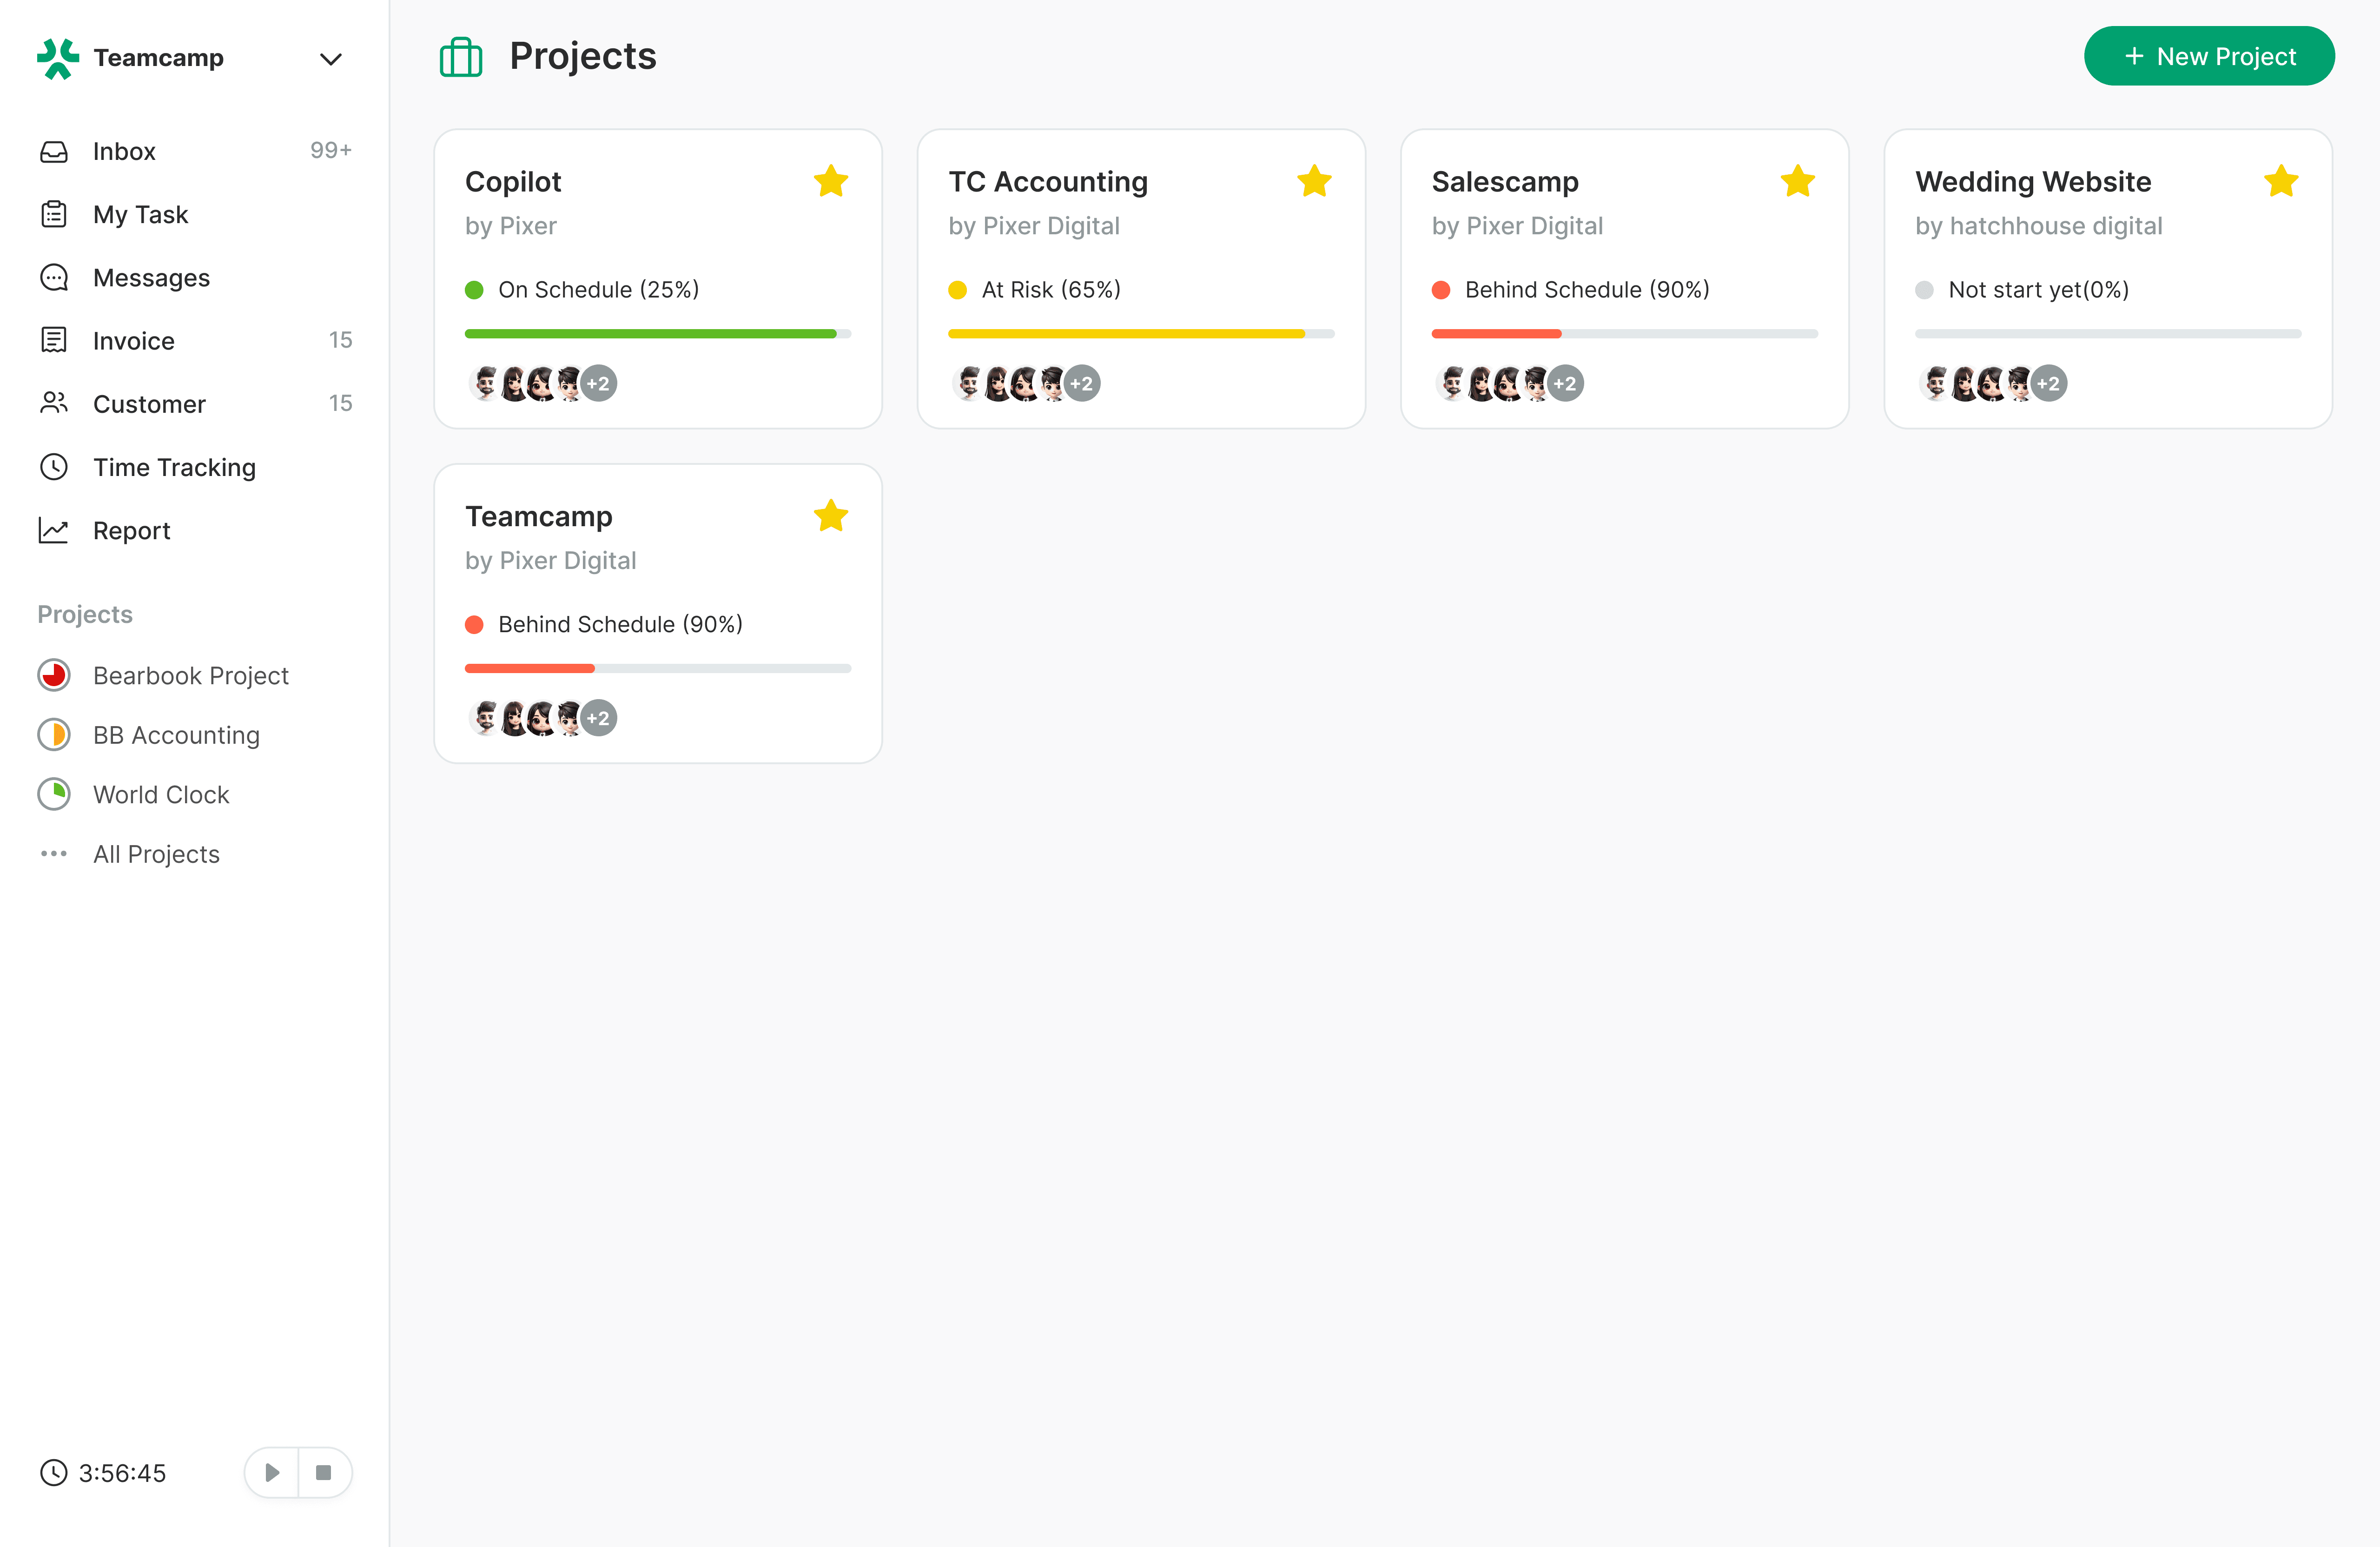
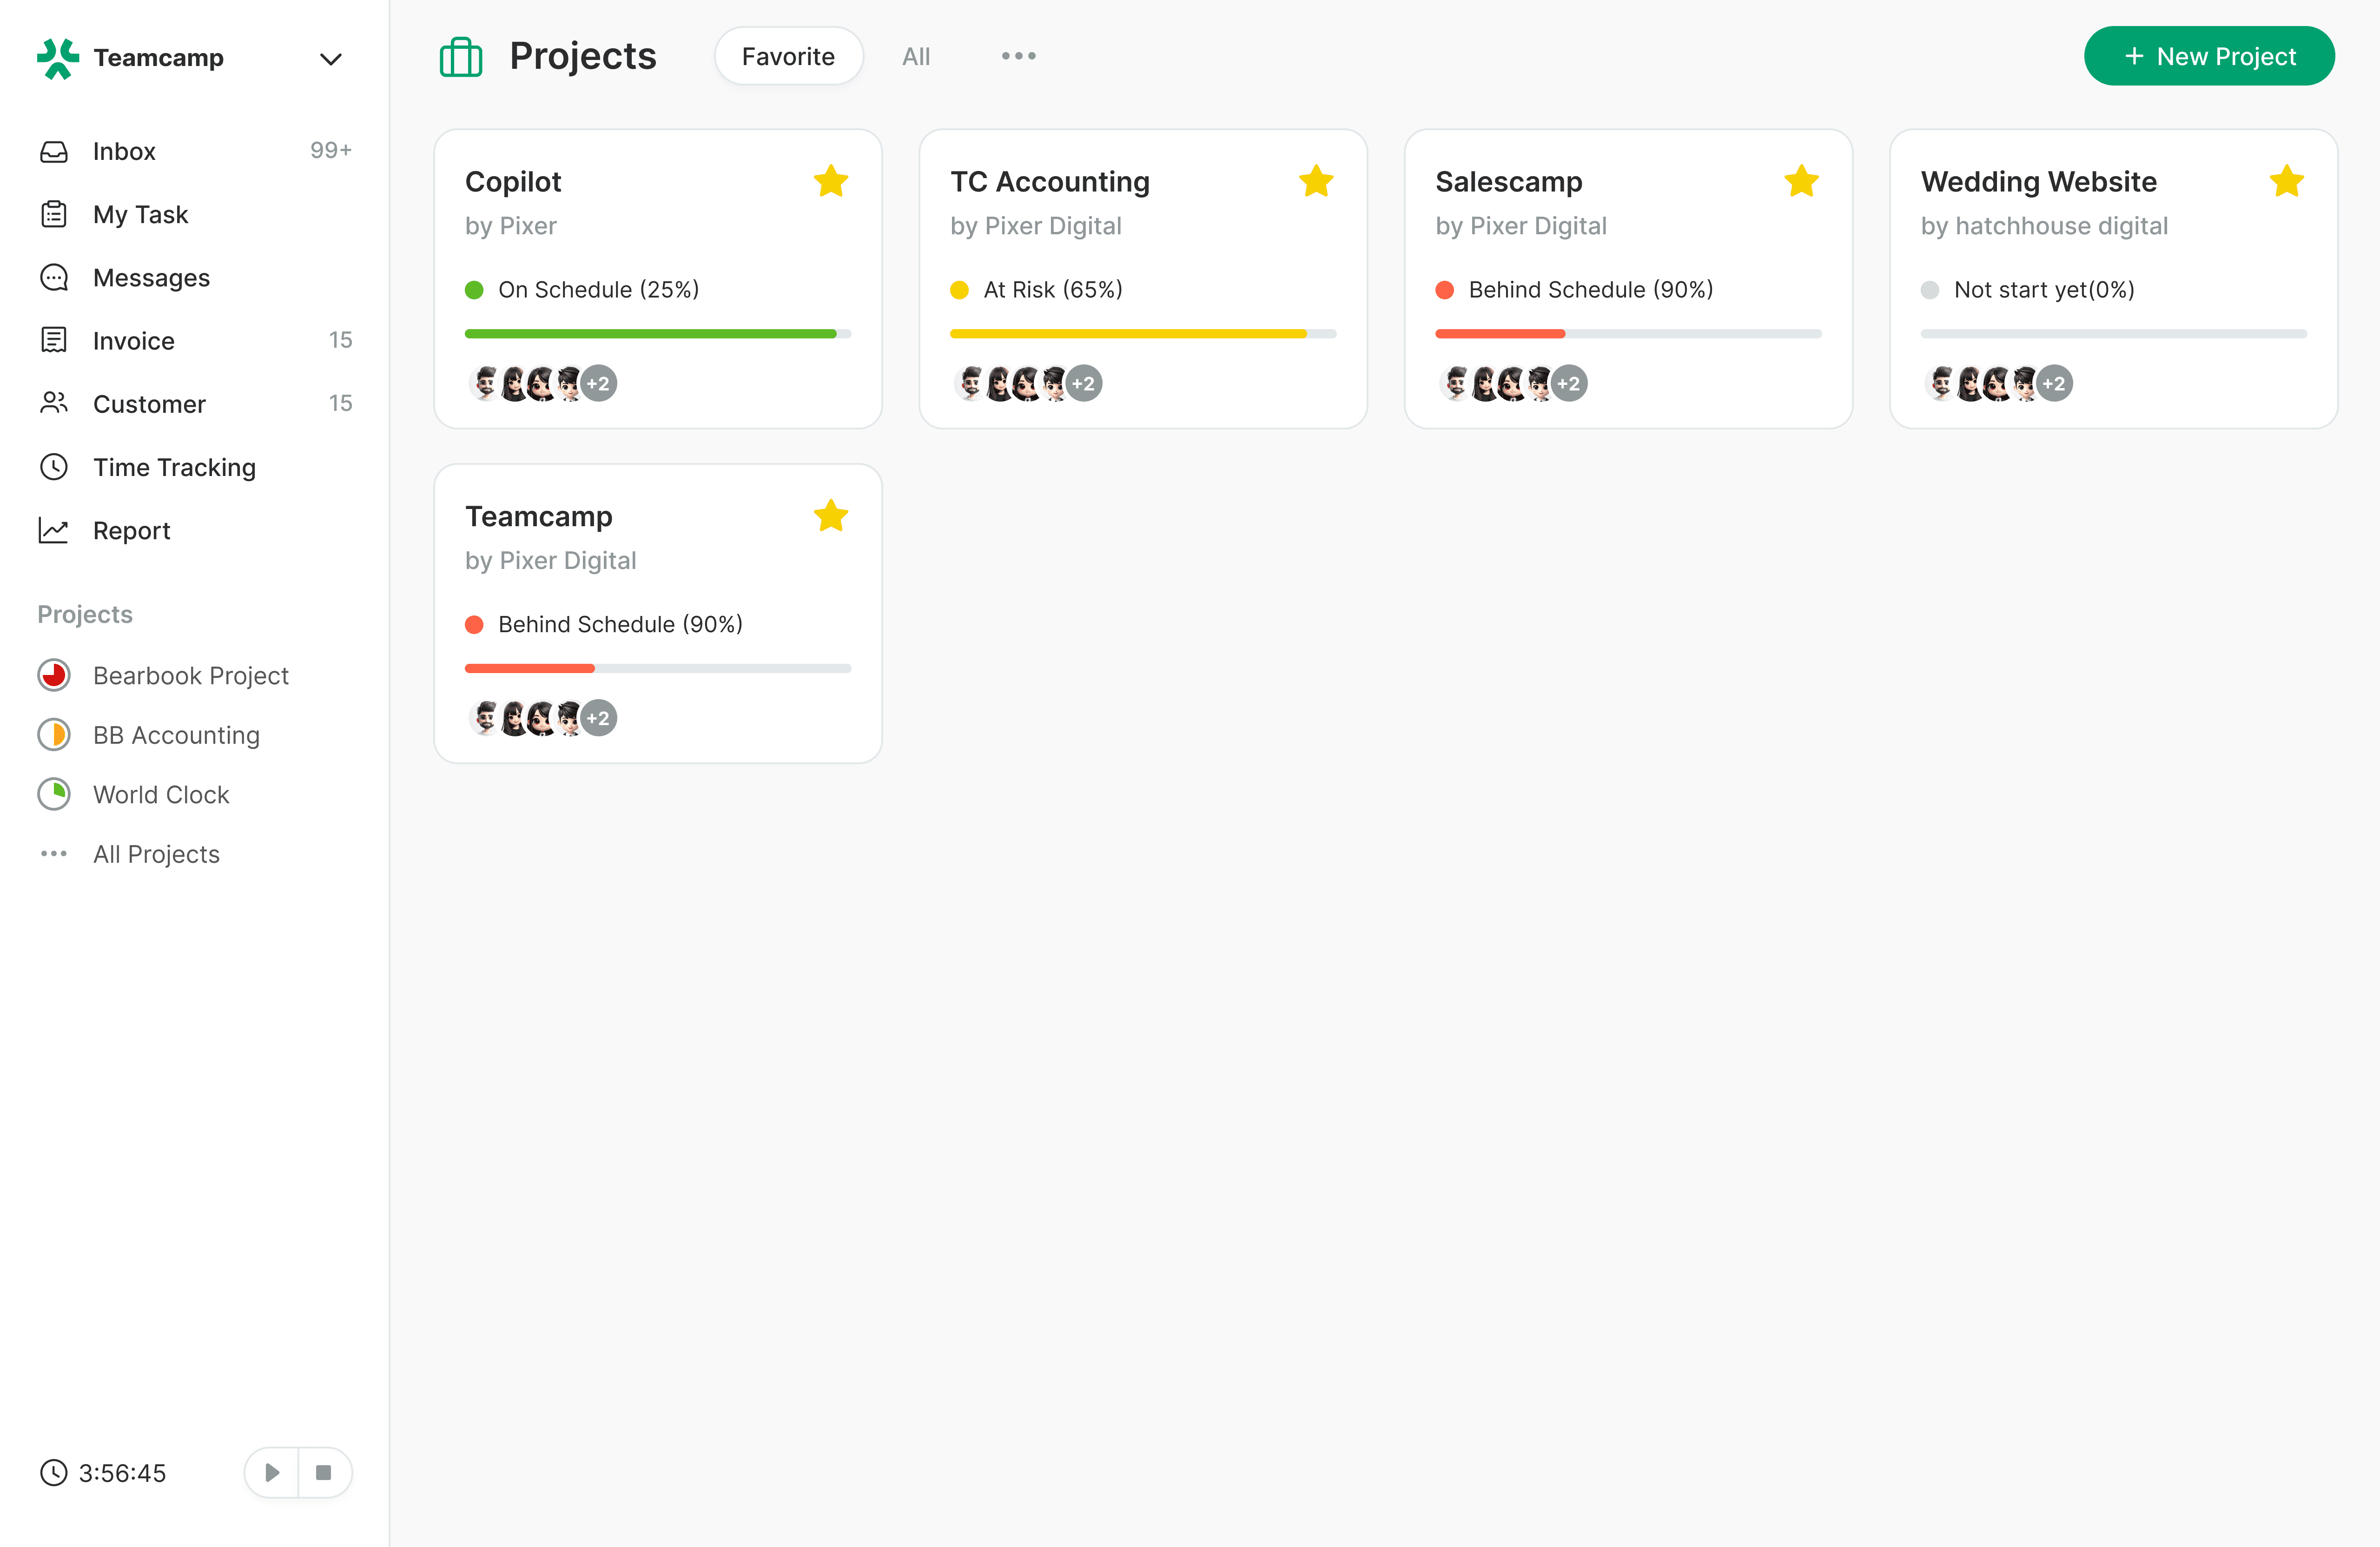
As collaborative project management increasingly relies on digital tools and platforms, integrating Pareto charts into these environments becomes crucial. Collaborative platforms, such as project management software and communication tools, are central to ensuring effective coordination among team members. Integrating Pareto charts into these platforms adds a layer of analytical capability, making data-driven decision-making more accessible to project teams.
Several project management tools now offer built-in support for Pareto analysis. These tools allow project managers to import relevant project data and automatically generate Pareto charts. This seamless integration simplifies the process for project managers, eliminating the need for manual data manipulation and chart creation.
Collaborative platforms can benefit from the integration of Pareto charts in multiple ways. Firstly, it enhances accessibility for team members who can easily view and interact with Pareto charts within the familiar project management environment. This promotes a shared understanding of project priorities and facilitates collaborative decision-making.
Moreover, integrating Pareto charts into collaborative platforms contributes to the real-time nature of decision-making. As project data is updated in real-time within these platforms, Pareto charts reflect the current state of the project. This dynamic aspect allows project managers to respond promptly to emerging trends or issues, fostering agility in decision-making.
The integration of Pareto charts into collaborative platforms also supports a more holistic view of project performance. By having Pareto charts alongside other project data and communication channels, project managers can comprehensively understand the project's dynamics. This holistic view facilitates more informed and nuanced decision-making, considering the interplay of various factors.
Additionally, collaborative platforms can leverage the interactive capabilities of Pareto charts. For example, team members can drill down into specific data points, exploring the underlying details of a particular issue or bottleneck. This interactivity promotes engagement and empowers team members to contribute actively to problem-solving and optimization efforts.
Future Trends: Pareto Charts and Collaborative Project Management
Incorporate Pareto charts into future trends, emphasizing their ongoing relevance and alignment with evolving collaborative technologies. The focus is on highlighting the enduring value of Pareto charts in navigating changing demands, ensuring their lasting significance and effectiveness in collaborative project management.
Looking ahead, the role of Pareto charts in collaborative project management is poised to evolve in tandem with technological advancements. One notable trend is the integration of artificial intelligence (AI) and machine learning (ML) into project management tools. Algorithms driven by artificial intelligence (AI) can swiftly examine large datasets and spot patterns and trends that conventional analysis techniques might not be able to.
This integration could enhance the predictive capabilities of Pareto charts, allowing project managers to anticipate potential issues and opportunities proactively. AI algorithms can continuously learn from project data, refining their insights over time. As collaborative projects become more data-intensive, the ability to harness AI for Pareto analysis could provide a significant competitive advantage.
Another emerging trend is the increased emphasis on real-time collaboration and communication. As remote and distributed teams become more prevalent, collaborative project management tools are evolving to facilitate instantaneous information exchange. When seamlessly integrated into these real-time communication channels, Pareto charts become even more impactful, providing teams with up-to-the-minute insights for agile decision-making.
The future landscape may also see the integration of Pareto charts with augmented reality (AR) and virtual reality (VR) technologies. Imagine a scenario where project teams can visualize Pareto charts in a virtual meeting space, interactively exploring data points and discussing optimization strategies. This immersive experience could further enhance collaboration and collective understanding among team members.
Conclusion
The conclusion synthesizes key takeaways, emphasizing the transformative impact of Pareto charts on collaboration efficiency. By encouraging project managers to recognize the strategic value of Pareto charts, the conclusion leaves a lasting impression on their potential to contribute to efficiency and success in collaborative projects. This comprehensive exploration of Pareto charts unfolds as a roadmap for project managers seeking to elevate their collaborative endeavors.
In conclusion, Pareto charts stand as powerful tools in the arsenal of collaborative project management. Their ability to distill complex data into actionable insights, prioritize critical tasks, and enhance communication makes them indispensable in the pursuit of project efficiency. The enduring relevance and adaptability of Pareto charts are signaled by their exploration of emerging trends and integration into digital platforms as technology continues to shape the landscape of collaborative project management.
Project managers equipped with the knowledge and proficiency in leveraging Pareto charts are poised to navigate the complexities of collaborative projects with agility and precision. As we step into the future of collaborative project management, Pareto charts remain a beacon, guiding teams toward optimized workflows, informed decision-making, and, ultimately, project success.
Share :


